You are likely to meet only two types of graphs in IELTS or other intermediate English tests – time and comparison graphs. (Sometimes you can get both in the same test!)
- In time graphs you have to describe changes over time.
- In comparison graphs you have to compare different items – countries, people, products, places, etc.
The vocabulary for each kind of graph is different:
- In time graphs you use time vocab to describe change: rose, fell, declined, shot up, increased, remained steady, etc.
- In comparison graphs you compare: twice as much as, more than, less than, the same amount, both X and Y have the same figure, etc.
Time Graphs
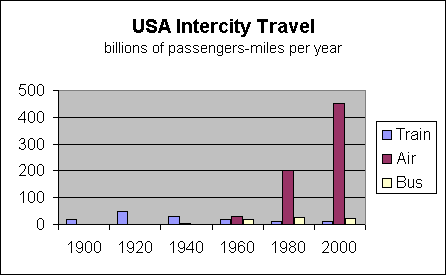
Here is a time graph.
You have to compare different methods of transport used in the US over the last century – train, bus and air.
You could start with
- train (because it is the oldest method)
- by air (because it is the biggest method of public transport today.)
- However, don’t start with bus because it is very small and not the main idea
The main trend with rail transport is that it rose to a peak in the 1920s and 1930s and then declined.
The main trend with air is that it started late, in the 1960s, but it has shot up to become by far the biggest carrier of passengers.
Comparison Graphs
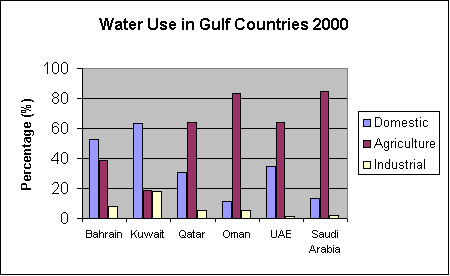
Here is a comparison graph.
You have to compare the amount of water used for domestic, agricultural and industrial purposes.
There are two ways to write about this graph:
- by country (make groups, e.g. Saudi Arabia and Oman, which have mainly agricultural use, then Bahrain and Kuwait which have mainly domestic use, etc)
- by use (Agriculture, then Domestic, then Industrial.)
If you decide to write by describing use, you could start with Agriculture because it is the biggest user. Group together Saudi Arabia and Oman as the top users, and then group UAE and Qatar as the middle group of users, using 60% of water for agriculture. Finally mention Bahrain and Kuwait.
Your second paragraph should be about Domestic use, the use of water in the home, because it is the second biggest use. Start with Kuwait and Bahrain (grouped together) (more than 50%) and then write about Qatar and the UAE.
More Stuff!
- You can find a lot (a LOT!) more on comparison graphs and time graphs at the Abu Dhabi Men’s College writing website. These two symbols –
 and
and  – are used there to indicate time graphs and comparison graphs.

